9 Top Test Automation Companies in the USA
September 10, 2026



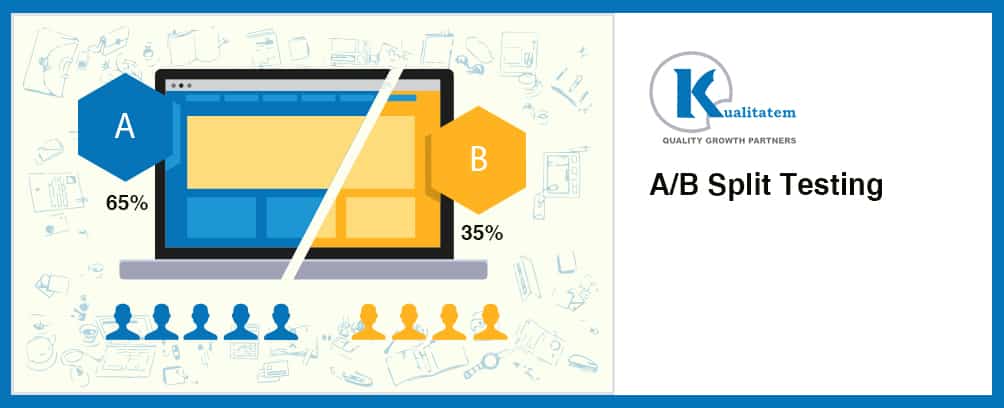
A/B split testing helps teams make website and software decisions using real user behavior. A team can compare two versions of a webpage, interface, feature, form, or user flow and measure which version performs better against a defined goal. Optimizely describes A/B testing as a method for comparing two versions of a webpage or app and measuring which performs better.
The goal may be a purchase, registration, download, form submission, subscription, or another measurable action. A/B testing gives teams evidence that can guide product decisions and reduce reliance on assumptions about what users prefer.
For example, VWO reports that Ben tested a product-page change with 40,347 users over about two weeks. The variation increased conversions by 17.63%. VWO also reports that SelectHub’s test produced a 13.47% improvement in purchases. These examples show how a focused change can produce a measurable business result when teams test it with real users.
This guide explains what A/B split testing is, how it works, the difference between A/B testing and split testing, what teams can test, when to use each approach, which metrics to track, how much traffic an experiment may need, how long tests should run, how to analyze results, which tools are available, and which mistakes teams should avoid. It also explains how A/B testing can complement usability testing and broader software QA. Nielsen Norman Group describes usability testing as observing participants as they perform realistic tasks with a product or service, which makes it complementary to behavioral experiments such as A/B testing.
A/B testing, also called A/B split testing or bucket testing, compares two or more versions of a digital experience and measures user behavior against a predefined goal.
Optimizely defines A/B testing as a method of comparing two versions of a webpage or app to determine which performs better. The platform describes the typical setup as a control, a variation, traffic split between the versions, and statistical analysis of the results.
The basic structure includes four parts:
For example, an online store can test an existing “Buy Now” button against a “Get Started” button. The team can measure completed purchases and revenue to determine which version performs better.
A/B testing can measure goals such as:
The goal is to understand which version produces the better measurable result. A design can look better to a team and still produce fewer conversions. A/B testing provides behavioral evidence that helps teams evaluate the actual effect of a change.
A/B testing and split testing often refer to the same general experimentation method. Many platforms use the terms interchangeably.
Some platforms use split testing to describe a more specific approach. VWO, for example, provides Split URL Testing, where different versions of an experience can be served through different URLs.
A practical distinction can help teams choose the right experiment.
| Factor | A/B Testing | Split Testing |
| Scope | Smaller or focused changes | Larger or substantial changes |
| Variations | Individual elements or focused versions | Different pages or experiences |
| Example | CTA wording or button color | Completely redesigned landing page |
| Main purpose | Optimization | Comparing major changes |
| Typical use | Fine-tuning an existing experience | Testing a new experience |
A/B testing often works well for focused changes such as:
The team can change one meaningful element and measure its effect.
Split testing can describe a comparison between substantially different experiences, such as:
The terminology varies across tools and organizations. The important point is to define the experiment clearly before collecting data.
A/B testing and split testing can work together.
Use a split-style test when you are comparing a major redesign or a substantially different user experience. Then use smaller A/B tests to improve the version that performs better.
For example:
Stage 1: Compare the existing landing page with a redesigned landing page.
Stage 2: Make the winning page the new control.
Stage 3: Test individual elements such as the headline, CTA, images, and form.
This approach gives teams a structured way to test major changes and then continue improving the winning experience.
A successful A/B test requires planning before traffic enters the experiment.
Start with one clear business or product goal.
The goal could be to:
The goal should connect directly to a measurable metric.
The current experience becomes the control.
For example, a six-field checkout form can serve as the control for a test that evaluates a three-field version.
Create a variation that tests a specific hypothesis.
For example:
Reducing the number of checkout fields will reduce friction and increase completed purchases.
The variation should contain the change required to test that hypothesis.
The testing platform distributes eligible users between the control and variation.
Optimizely’s current experiment documentation describes traffic allocation as the process of splitting traffic between variations and the original experience.
Run the versions under comparable conditions.
Avoid major unrelated changes during the experiment because they can affect user behavior and make the result harder to interpret.
Track the primary metric and relevant secondary metrics.
For a checkout experiment, the team might track:
Optimizely recommends defining the primary metric before evaluating the experiment. Secondary metrics can help teams understand downstream effects.
The experiment can produce three common outcomes:
Statistical analysis helps determine whether the observed difference provides enough evidence to support a decision.
A reliable winning variation can become the new control.
The team can then use that version as the starting point for another experiment.
This creates a continuous testing process instead of treating each experiment as a one-time activity.
Teams can test many parts of a website or software product. A focused experiment makes it easier to understand which change affected the result.
Test:
A headline can affect how quickly users understand the value of a product or service.
Test:
Test:
Test:
For example, a team can compare “Buy Now” with “Get Started” and measure completed purchases rather than only button clicks.
Test:
A shorter form may reduce friction, but the team should measure completed submissions and lead quality.
Test:
Test:
Test:
Teams should focus each experiment on a clear variable or hypothesis. Changing many unrelated elements at once makes it harder to understand what caused the result.
The right metric depends on the objective of the experiment.
Common A/B testing metrics include:
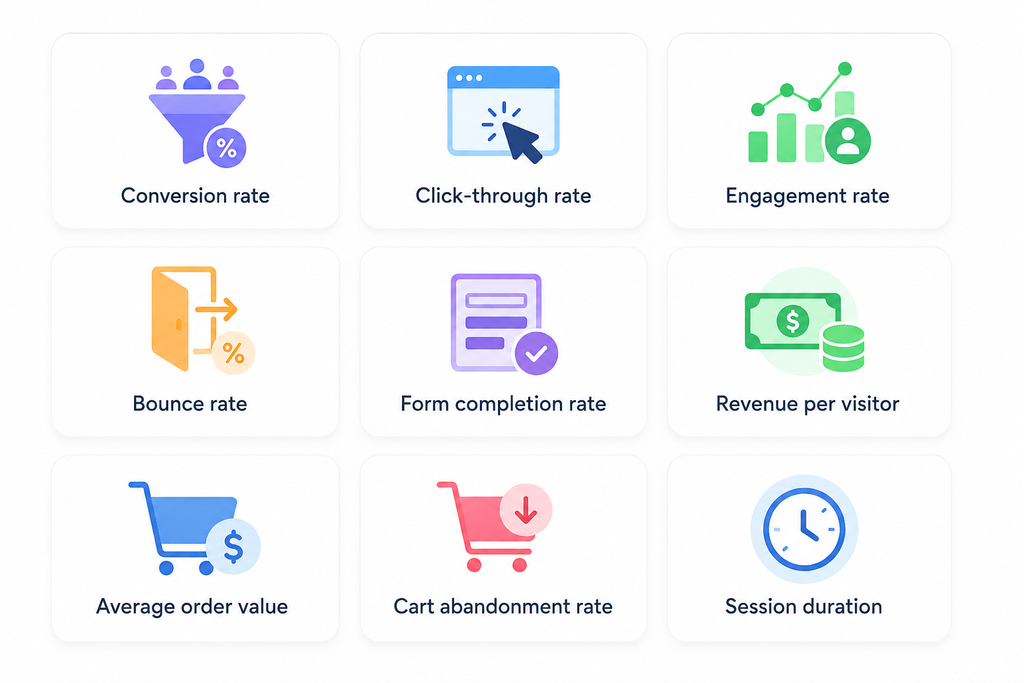
The primary metric should match the business goal.
For example, a checkout experiment should focus on completed purchases and revenue. A higher CTA click rate can look positive while completed purchases decline.
A VWO case study provides a useful example. In its Kisah case study, VWO reports that one product-detail-page experiment produced a 91% increase in conversion rate and an 86.7% increase in revenue. The overall experimentation program reported a 120% increase in revenue across several experiments.
The example also shows why teams should consider business metrics alongside interaction metrics.
There is no single traffic number that works for every A/B test.
The required sample depends on factors such as:
Optimizely’s current fixed-horizon documentation explains that sample size depends on the baseline metric, minimum detectable effect, significance level, and data variance. It recommends calculating the required sample before the experiment begins.
The expected improvement also affects the required traffic. A large improvement is easier to detect than a small improvement.
For example, Optimizely explains that a low baseline conversion rate can require more visitors before a test provides enough evidence. Its documentation uses ecommerce purchase conversion as an example of a low-frequency event that can require more traffic.
Teams can use an A/B testing sample-size calculator to estimate the required visitors before launching a test.
The important point is simple: decide how much data you need before you start interpreting the result.
Test duration depends on traffic volume, conversion rate, expected improvement, sample-size requirements, and experiment design.
A low-traffic website may need more calendar time than a high-traffic website to collect the same amount of evidence.
Optimizely’s current guidance explains that sample size affects experiment length. It also recommends considering a full business cycle so that normal differences in user behavior across the week can be represented in the data.
Teams should consider:
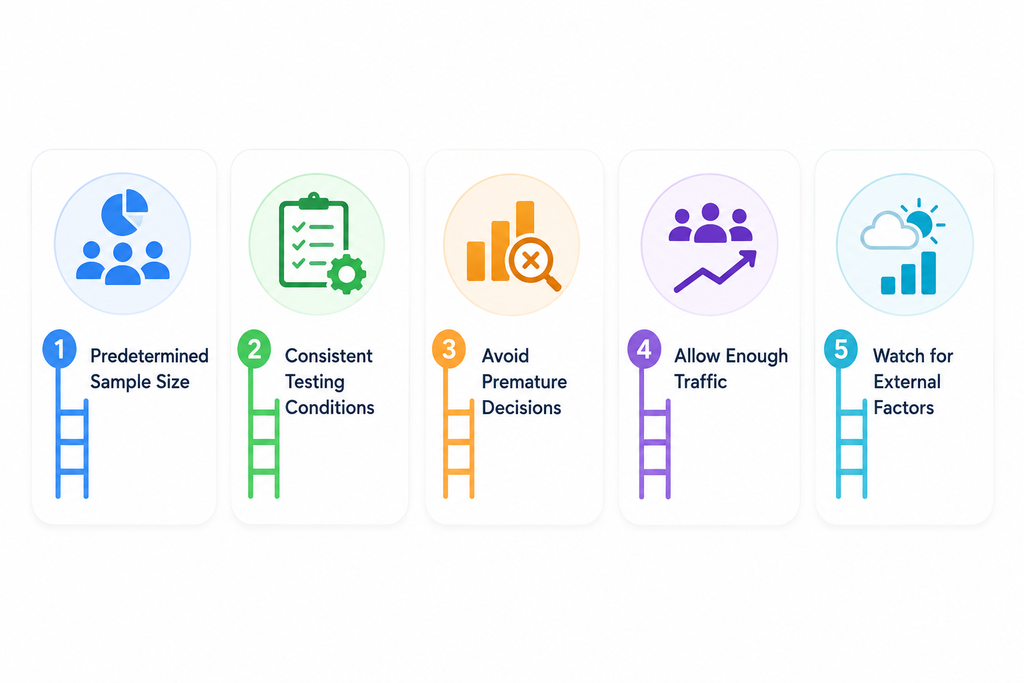
Estimate the required sample before the experiment starts.
Keep major marketing, pricing, technical, and product changes consistent while the test runs.
Early results can change as more users enter the experiment.
Optimizely’s fixed-horizon documentation specifically warns that repeatedly checking partial results and stopping early can increase false-positive risk.
Give the experiment enough time to collect the required data.
Long-running tests can encounter changes in:
These changes can affect the experiment population and make results harder to compare.
There is no universal number of days that makes an A/B test valid. The duration should follow the experiment design and the amount of data required.
Start with the metric defined before the test.
If the goal was to increase purchases, compare purchase conversion rates and revenue.
Statistical significance helps teams determine whether an observed difference could reasonably come from random variation.
Optimizely explains that statistical significance evaluates how unusual the observed result would be when there is no actual difference between the baseline and variation.
A 3% improvement does not automatically mean the variation is better. The team needs enough evidence to determine whether the difference represents a meaningful effect.
Review supporting metrics after the primary metric.
For example, a CTA variation can increase clicks while completed purchases decline.
There are three possible outcomes:
Variation wins: The variation produces a reliable improvement.
Control wins: The existing experience performs better.
Test is inconclusive: The available evidence does not support a reliable winner.
An inconclusive result can still provide useful information. The team may learn that the tested change had a small effect or that a different hypothesis deserves attention.
A reliable winning variation can move into production.
The result should also be documented so future experiments can build on the finding.
| Test | Control | Variation | Goal |
| CTA | “Buy Now” | “Get Started” | Increase conversions |
| Headline | Existing headline | Benefit-focused headline | Improve engagement |
| Product image | Single image | Multiple product images | Increase purchases |
| Form | 6 fields | 3 fields | Increase submissions |
| Pricing | Monthly price | Annual savings emphasized | Increase subscriptions |
| Checkout | Multi-step checkout | Simplified checkout | Reduce abandonment |
Hypothesis: “Get Started” will communicate a lower-friction next step and increase completed conversions.
The team should use completed conversions as the primary metric when that action represents the business goal.
Hypothesis: A benefit-focused headline will help users understand the product’s value and encourage more engagement.
Hypothesis: Additional product images will give shoppers more information and increase purchase confidence.
Hypothesis: Removing unnecessary fields will reduce friction and increase completed submissions.
Hypothesis: Showing annual savings more clearly will encourage more users to choose an annual subscription.
Hypothesis: A simplified checkout will reduce friction and increase completed purchases.
Real case studies provide useful context for understanding how experiments can affect business metrics.
VWO reports that Ben ran an A/B test on a product page with about 40,347 users over two weeks.
The original page placed the phone color palette below the product image. The variation moved the palette next to the image so users could understand its purpose more easily.
The control had a reported conversion rate of 2.20%, while the variation reached 2.59%. VWO reports a 17.63% increase in conversions.
Hypothesis: Making phone-color selection easier to understand would reduce confusion and improve conversions.
Read the full Ben A/B testing case study from VWO
VWO reports that SelectHub tested changes to product-page navigation and CTA presentation.
The variation used contrasting CTA colors and section-based navigation to make information easier to find. The test produced a 13.47% improvement in purchases.
Hypothesis: Better navigation and clearer CTA presentation would help visitors find product information and take action.
Read the full SelectHub A/B testing case study from VWO
VWO reports that Westfund tested a prominent “Get a Quote” CTA in the top navigation.
The variation increased users starting a quote by 10.82% and quotes generated by 10.24%. These improvements contributed to a 28.84% increase in new member joins and a 32% increase in value.
Hypothesis: Making the quote CTA easier to find would increase entry into the quote journey and improve downstream results.
Read the full Westfund A/B testing case study from VWO
These examples show why teams should connect A/B tests to the complete customer journey. A change can affect an early interaction and produce a later business outcome.
Every experiment should answer a specific question.
A clear hypothesis helps the team understand what changed and why the change should affect user behavior.
Choose the primary metric before launching the experiment.
Optimizely recommends defining primary and secondary metrics during experiment planning.
Prioritize changes that have a reasonable connection to user behavior or business outcomes.
The audience should reflect the users who normally interact with the website, application, or feature.
Keep unrelated changes out of the experiment whenever possible.
Estimate the required sample before launch. This gives the team a clear basis for deciding when enough data has been collected.
A focused experiment makes the result easier to explain.
When a team needs to study several interacting variables, a multivariate design may be more appropriate. Optimizely describes multivariate testing as a method for evaluating combinations of variables.
Record:
A/B testing should create a continuous learning process. Each result can inform the next experiment.
Early results can change as more users enter the experiment.
A test should have a clear reason behind the change.
Small samples can produce unstable results.
Multiple changes make the result harder to attribute.
Clicks can increase while purchases or registrations decline.
A numerical difference does not automatically provide enough evidence for a decision.
Changes to the variation, traffic allocation, targeting, or measurement can affect the experiment.
Major promotions, seasonal events, product launches, and traffic-source changes can influence behavior.
A test can improve the primary metric while creating an unwanted effect elsewhere.
A completed experiment has limited business value when the organization does not apply the learning.
A/B split testing can help organizations:
The business value depends on the goal of the experiment.
For example, a simplified checkout can reduce friction and increase completed purchases. A clearer onboarding flow can help more users reach an activation milestone. A better product page can improve conversion and revenue.
A/B testing and usability testing answer different questions.
A/B testing asks: Which version performs better?
Usability testing asks: Can users understand and use the experience successfully?
Kualitatem’s usability testing services focus on identifying where users struggle with software, including navigation, forms, and other parts of the user experience.
The two approaches can work together.
For example:
This combination gives teams both qualitative and quantitative information. Usability testing can help explain why users struggle. A/B testing can help measure which solution performs better.
A/B testing also applies to software products and web applications.
Teams can test:
For example, a SaaS company can test two onboarding flows and measure how many new users reach an activation milestone.
A software team can test a new search interface and measure whether users find relevant results more often.
A mobile application can test a shorter registration process and measure completed registrations.
The behavioral result is one part of software quality. Teams should also validate functionality, compatibility, accessibility, security, and performance.
Kualitatem’s QA automation services cover web, mobile, API, functional, regression, performance, security, and accessibility testing. The current service page also describes automation for CI/CD pipelines and end-to-end user journeys.
Teams can also use performance testing services to evaluate response time, scalability, and application behavior under different workloads. Kualitatem describes performance testing as a way to compare performance characteristics, identify performance problems, and evaluate systems against performance requirements.
For teams that want to explore the broader role of automation, Kualitatem also provides resources on software testing automation.
A/B testing tools have different strengths. Teams should select a platform based on their website or application architecture, experimentation needs, analytics requirements, and development workflow.
VWO’s experimentation platform supports A/B testing and other experimentation approaches.
Typical use: Website and product teams that need experimentation and behavioral analysis.
VWO also provides first-party case studies that show how teams have used experiments to improve conversions and purchases.
Optimizely’s A/B testing resources guide A/B testing, experimentation design, metrics, and statistical analysis.
Typical use: Organizations that need experimentation across web and product experiences.
Optimizely also provides documentation for sample-size planning and fixed-horizon testing.
AB Tasty provides experimentation and personalization capabilities for digital experiences.
Typical use: Teams that run experiments across websites and digital channels.
Statsig provides product experimentation capabilities for software teams.
Typical use: Product and engineering teams that want experimentation within the software development process.
LaunchDarkly combines feature management with experimentation.
Typical use: Software teams that use feature flags and controlled feature releases.
Consider:
The right platform should fit the team’s technical setup and experimentation process.
A/B split testing compares two or more versions of a webpage, application, feature, or digital experience and measures which version performs better against a defined goal.
The terms often describe the same general method. Some platforms use split testing to describe different URLs or larger experience changes.
A/B testing often focuses on individual or focused changes. Split testing can describe substantially different pages or experiences.
Teams define a goal, establish a control, create a variation, divide users between the versions, collect data, analyze the result, and apply the learning.
Teams can test headlines, images, copy, CTAs, forms, pricing, navigation, social proof, onboarding, checkout, and product features.
The test should run long enough to collect sufficient data under comparable conditions. Duration depends on traffic, conversion rate, expected improvement, and experiment design.
The requirement depends on the baseline metric, expected improvement, significance level, number of variations, and data variability. A sample-size calculator can help estimate the requirement.
Track metrics that match the test objective. Common metrics include conversion rate, click-through rate, engagement, form completion, revenue per visitor, average order value, and abandonment rate.
A/B testing helps teams make evidence-based decisions, improve digital experiences, increase conversions, and learn more about user behavior.
Common mistakes include ending tests too early, using insufficient data, testing without a hypothesis, changing the experiment during the test, focusing only on clicks, and ignoring secondary metrics.
VWO, Optimizely, AB Tasty, Statsig, and LaunchDarkly are examples of current experimentation platforms.
Yes. Teams can test features, interfaces, onboarding, navigation, search, forms, checkout, and other application experiences.
A/B testing compares the performance of different versions. Usability testing examines how successfully users understand and use an experience.
A/B split testing helps organizations make decisions from measurable user behavior. Teams can compare a control with a variation and use data to understand which experience supports their business goal.
A strong testing process starts with a clear hypothesis and a defined primary metric. The team then chooses an appropriate test design, estimates the required sample size, collects enough data, evaluates statistical significance, reviews secondary metrics, and applies the result.
Real experiments show how these decisions can affect business outcomes. VWO reports a 17.63% conversion increase from Ben’s product-page experiment, a 13.47% increase in purchases from SelectHub’s experiment, and a 32% increase in value from Westfund’s experiment.
A/B testing works best as part of a broader software quality process. Usability testing can identify experience problems, A/B testing can compare potential solutions, QA automation can validate repeatable functionality, and performance testing can evaluate system behavior under load.
When these practices work together, organizations can use evidence to improve websites and software products while building a continuous process of product learning and optimization.

Nabeesha is a Digital Content Executive at Kualitatem Inc. With a background in communication and extensive knowledge of QA and cybersecurity, she brings a business-first lens to technical content. Her work helps CTOs and engineering leaders cut through the noise and make confident decisions about software quality.
Not sure where your QA stands?
Speak to an Expert



Our experts are all ready. Explain your business needs, and we’ll provide you with the best solutions. With them, you’ll have a success story of your own.
Contact us now and let us know how we can assist.