Calculate Automation Testing ROI for Enterprise Teams
April 7, 2026


Performance testing lets you know when an application is lagging. As traffic increases, it displays longer response times and increasing latency. However, it doesn’t address the causes of those issues.
APM bridges that gap. It shows the precise code, service, or database call that is causing delays for each request as it moves through the system.
This guide explains which metrics are most important, how APM works with load, stress, and soak tests, and how teams can use APM to identify actual bottlenecks prior to release.
Classic performance testing answers three basic questions:
These ideas form the basis of our performance testing service, which use load, stress, soak, and volume tests to assess scalability, response times, and throughput before release. The problem is that symptoms are often included at the end of test reports. You might observe that the login flow times out during busy times or that page rendering lags as database connections grow.
When a scenario fails, the APM view appears:
By combining performance monitoring and testing, teams get both the outside view from load tools and the inside view from APM traces.
APM platforms gather metrics, logs, traces, and user experience data from live systems during regular operations. The same capabilities are aimed at a controlled environment during performance testing.
A typical APM setup for tests includes
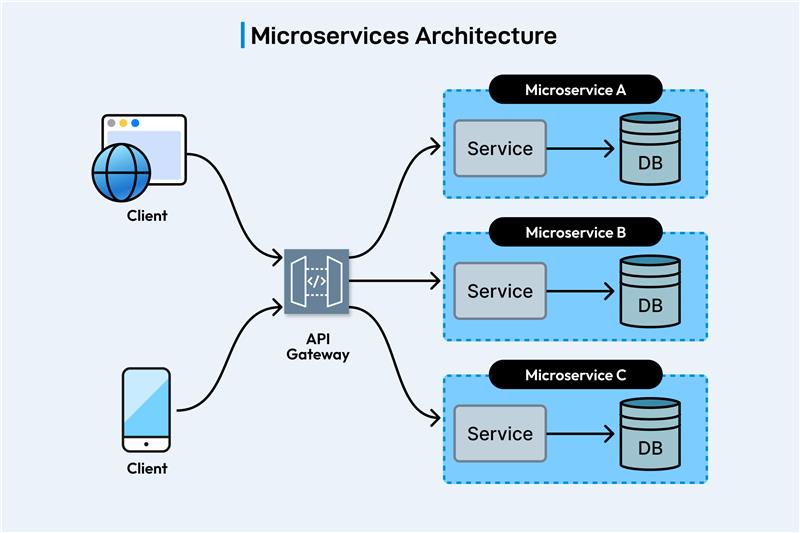
The majority of contemporary APM platforms additionally provide service maps and distributed tracing. During performance testing, APM turns basic metrics into a deep dive performance analysis of how each service behaves under load.
Response time shows how long one request takes to finish.Throughput shows how many requests the system can handle each second. Our guide on response time vs throughput in performance testing explains this difference clearly.
APM adds the missing piece: why these metrics change under load. When traffic increases and performance suddenly drops, APM shows the exact cause.
For many teams, starting with a single key business flow, such as account opening, checkout, or trade placement is the easiest way to incorporate Application Performance Monitoring (APM) into Performance Testing.
A simple workflow we often recommend looks like this:
| Step | What You Do | Purpose |
| 1. Pick a key flow | Choose one workflow like checkout or trade placement. | Focuses testing on high-value actions. |
| 2. Enable APM agents | Turn on agents on servers, APIs, and databases. | Captures end-to-end visibility. |
| 3. Run baseline load | Start with moderate traffic and record metrics. | Creates a reference point. |
| 4. Push peak load | Increase virtual users to expected max levels. | Reveals stress behavior and limits. |
| 5. Compare results | Review baseline vs peak in APM traces. | Identifies slow calls and bottlenecks. |
Although APM adds more detail to performance testing, its true benefits are felt in daily tasks. It impacts how teams discuss risks, interpret results, and respond quickly to problems.
Response time graphs may move quickly during a demanding test run. It is difficult to determine which part of the system is causing a sudden spike in the absence of APM. Testers can observe which endpoints, queries, and services light up at the precise moment the issue arises when APM is enabled.
When running targeted load tests on a single feature, this type of live view is helpful. When you use a more comprehensive approach to performance testing across numerous releases and environments, its value increases even further.
The time saved during debugging is one of the main benefits of Application Performance Monitoring (APM) in performance testing. Rather than attempting to replicate a random slowdown for days, testers can view a single trace and determine:
These traces are frequently paired with baseline and benchmark testing results by teams. This kind of tracing and profiling in performance QA helps teams move from guesswork to evidence when they debug slowdowns.
Everyone is impacted by performance issues, but each group views them differently. Test coverage and repeatability are important to QA teams. Developers concentrate on queries and code paths. Owners of businesses want to know if a release is safe.
APM helps the linking of these perspectives. It is much simpler to explain why a particular bottleneck is important when a report contains both the user-level metrics and a few clear APM screenshots. Stakeholders can observe the clear connection between a revenue-generating user flow and a slow endpoint.
Compared to a generic note about “performance being poor,” a brief summary such as “25 percent of checkout time is spent waiting for this inventory API” is much easier to set up.
APM is adaptable. It doesn’t fit into any one test category. It improves the load, stress, soak, and benchmark tests that are already included in established performance testing services.
Load tests examine how the system responds to anticipated traffic. In order to determine where it breaks, stress tests push it past that point. APM may show which system components experience the most damage in both situations.
Common patterns APM can reveal:
This data also supports capacity planning on cloud-based systems.
Short tests may not always reveal memory leaks, connection leaks, or slow drain of resources. It takes many hours to finish the endurance and soak tests. In this case, APM time-series graphs and traces are used to identify slow drifts that are easy to miss in a report.
Teams have a better chance of identifying these problems before they affect production when they combine APM with continuous monitoring in performance testing. Even if the system hasn’t failed yet, the APM charts will show a trend if a service gradually increases memory usage over the course of six hours.
To compare releases, environments, or infrastructure options, many organizations conduct tests on a regular basis. We explain how baseline and benchmark testing work in our article on performance testing. APM gives this image more detail.
You might have useful answers to questions like
You can compare individual traces from the old and new runs rather than depending solely on high-level averages.
It is helpful to run APM during a major annual performance test, but it is far more beneficial when it is integrated into a continuous flow. Every significant change is tested before it is made available to users, and many teams are shifting toward frequent checks in CI/CD.
Unit, API, and user interface tests are already performed by modern pipelines. When APM is enabled, adding targeted performance tests for important flows provides an early warning when a change slows down operations.
A simple pattern looks like this:
How frequent testing fits into fast release cycles is explained in our guide continuous testing in CI/CD. APM provides more details within that model, allowing you to identify the specific area of the stack that changed in addition to simply knowing that “something got slower.”
The tests and data that feed APM decide how useful it is. The traces might not accurately represent behavior if the scenario makes use of fake information or a very small dataset. APM metrics also gain greater significance when load tests take place using that type of data. Realistic traffic spikes, actual account states, and actual shopping carts all have an impact.
We’ve also shared resources on production data versus synthetic test data to help teams choose data sources while keeping privacy intact.
Application Performance Monitoring (APM) is vital to performance testing. It’s a helpful way to combine user experience, system metrics, and code behavior into one picture.
If your team already runs regular performance tests, there’s no need to start from scratch. You can start out small:
Expanding coverage to more flows, environments, and release pipeline stages becomes simpler.
Once teams get there, performance testing becomes a continuous feedback loop that supports each release rather than a one-time obstacle.


Our experts are all ready. Explain your business needs, and we’ll provide you with the best solutions. With them, you’ll have a success story of your own.
Contact us now and let us know how we can assist.